Table of Contents
Locations Diagram
Introduction
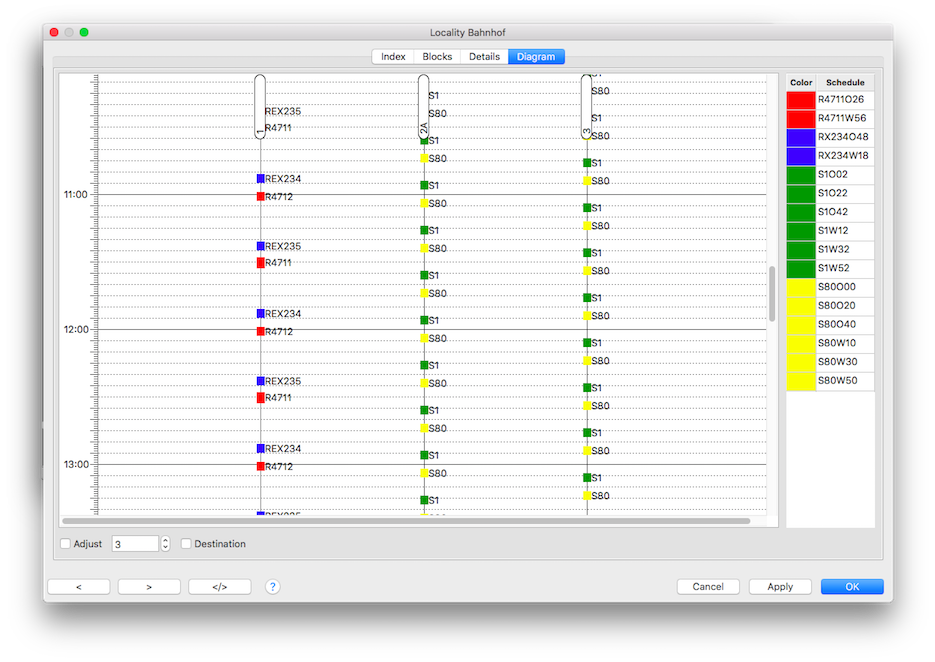
The Diagram tab shows a graphical representation of the selected location.
| Relative schedules cannot be visualised and will be skipped. |

The graphical location representation will show all location blocks and the hourly/absolute schedules which affect it.
This will show the operating grade of this location.
Retention time
The retention time will be shown as a vertical rectangle and is calculated as follows:
- depart time - arrive time
- If arrive time is not set: Min. wait + 1 minute
Block labels
If no platform name is defined the block ID will be shown.
Options
Adjust
Scale the graphic to the height of the dialog.
If not set, the scaling factor can be selected between 1 and 5. (Scrolling will be activated.)
Destination
Show the final destinations in the graphic.
Schedule List
On the right there is a list of schedules with corresponding color.
A double click on a schedule line will open the schedule properties dialog.

