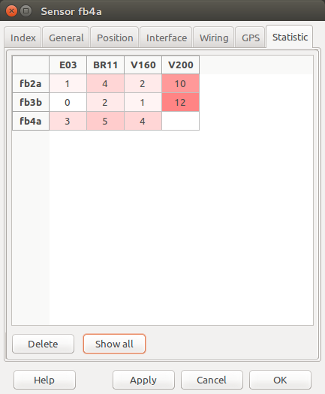
sensor-statistic-en
Table of Contents
Statistic
Introduction
In combination with RailCom this Statistic Tab can be filled with signal quality reports. (0…100%)
The individual cell background color will be white for zero values and pure red for values greater or equal then 50.
The red saturation for all values less then 50 are interpolated.
The values reported are the percentage of the lost packets; The higher the value, the worse the quality.
- If the red color is horizontal, the rails connected to the specified sensor should be cleaned.
- If it is vertical, the wheels of the specified locomotive should be cleaned.
Supported Command Stations:
- BiDiB GBMBoost Master
Delete
Delete all statistic records of the selected sensor.
Show all
Show all statistic records from all sensors in one grid.
sensor-statistic-en.txt · Last modified: 2021/02/10 16:38 by 127.0.0.1


